Help and Resources
1. What is stock rating, how to use it?
2. What is Short Term Stock Rating, Meter
3. What is Long Term Stock Rating, BBI
4. How to use BBI and Meter together
6. Other Terminologies or notations:
7. How to use your web function - Meter by Stock
8. How to read these buy and sell on tables?
9. How do I use Search Stocks?
10. How do I use the Portfolio Feature?
11. How do I modify an existing portfolio?
1. What is stock rating, how to use it?
We have two proprietary stock rating indicators, Meter and BBI (Bull Bear Index). Both of them are used for defining the trend and strength of the underlying security.
Back To Top ->
2. What is Short Term Stock Rating, Meter
Meter is the short-term stock rating, it ranges from +100 to -100 (from bullish to bearish, 0 is neutral), each increment is 25.
+100 is the strongest strength (most bullish rating) and -100 is the weakest rating (most bearish rating). Green color represents strength, red color represents weakness. When color changes from Red to Green, it is a bullish signal; when color changes from Green to Red, it is a bearish signal.
Illustration 1: Apple Stock
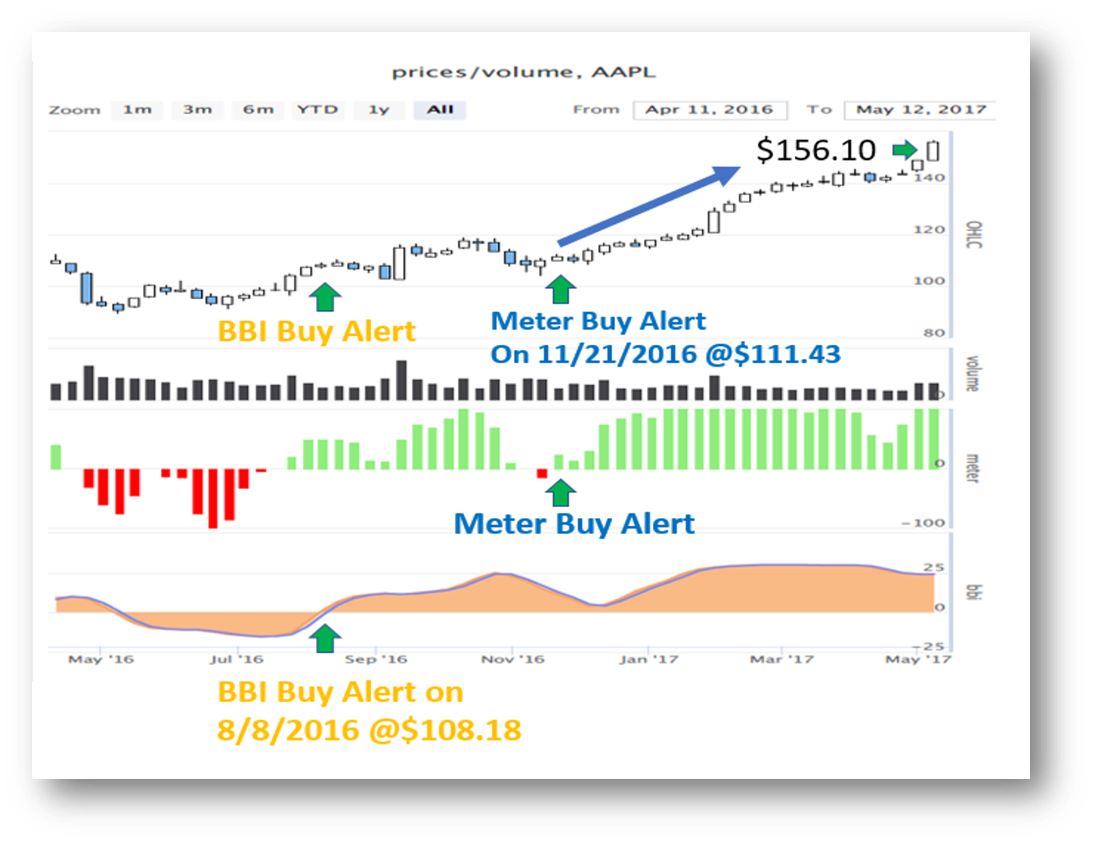
Using AAPL stock as an illustration (as in illustration 1),The last time onvest rating system gives the latest bullish signal on Apple was the week ending on 11/21/2016, when Apple closed at $111.43, at that time, The stock rating indicated that Apple stock turned from Bearish to Bullish. As 5/13/2017, Apple stock remain strong, as the Meter is still positive in the green zone, closing price was $156.10,it rose 40.08%,the stock rating still indicates to hold/long for Apple due to strength.
Illustration 2: IBM Stock
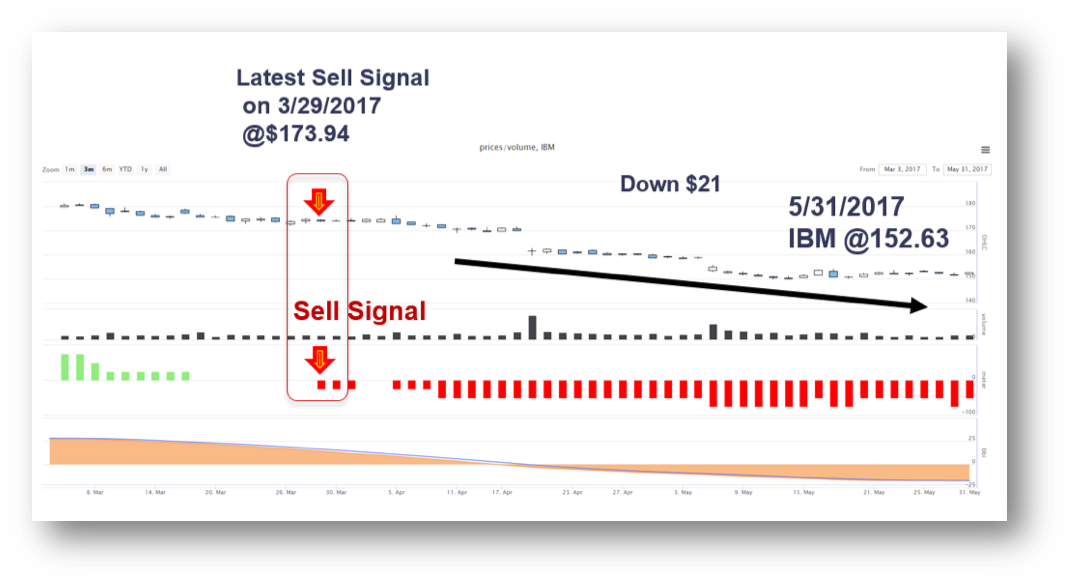
Using IBM stock as an illustration (as in illustration 2),the last time onvest rating system (Meter) gave the latest bearish signal on IBM was the week ending on 3/29/2017, when IBM closed at $173.94, at that time, The stock rating indicated that IBM stock turned from Bullish to Bearish. As 5/31/2017, IBM stock remains weak, as the Meter is still negative in the red zone, closing price was $152.63,it was down -$21 in 2 months,the stock rating (Meter) still indicates a sell for IBM due to weakness.
Back To Top ->
3. What is Long Term Stock Rating, BBI
BBI is a smooth version of the meter. It is a longer-term stock rating. It ranges from +30 to -30. Positive numbers is bullish, negative number is bearish. When BBI turns from negative to positive numbers, cross above zero, it is bullish signal. When BBI turns from positive to negative, the line crosses below zero, it is a bearish signal. The blue line with BBI is a 5-Day simple moving average of BBI.
Illustration 1: Apple Stock

Using Apple stock in Illustration 1, The last time that BBI indicated a bullish signal was on 8/8/2016, stock was closed at $108.18 for the week ending 8/8/2016, as of 5/12/2017, stock closed at $156.1, it rose 44%。As BBI is still positive, it indicates continue strength and should continue to hold/long.
Back To Top ->
4. How to use BBI and Meter together
BBI and Meter can be used separately or jointly together. When use them jointly, you get more confirmation.
a. When BBI is positive, it indicates longer term strength with consistency. It is safer to buy or hold securities that have positive Meter reading, it is a bullish confirmation.
b. When BBI is negative, it indicates longer term weakness with consistency. It is safer to sell or short sell securities that have negative Meter reading, it is a bearish confirmation.
c. When BBI and Meter do not confirm, one is negative and the other is positive, then the BBI is should be more reliable, it has higher consistency.
Back To Top ->
5. What are these indicators?
ATR: Average True Range
Gap 5d(%): The % of gap in the last 5 trading days, + meaning gap up %, - means gap down %
ADR: Average True Range (do not count gap), the average daily range of the last 5 trading days
Meter: Our proprietary Short term stock rating, ranges from -100 to +100, each increment is 25
BBI: Bull Bear Index, our proprietary longer term stock rating, ranges from -30 to +30
Adjclose: The adjusted close end of day price
SMA20: 20 period simple moving average
SMA50: 50 period simple moving average
1d mtm (%): price change in % from previous trading day
5d mtm (%): price change in % from the previous 5th trading day
Back To Top ->
6. Other Terminologies or notations:
For signals, we define them as regular signal and small signal
sB: Small Buy, when an indicator changes from negative to zero; it is an half step toward positive
bB: Big Buy, when an indicator change from negative to positive
sS: Small Sell, when an indicator changes from positive to zero; it is an half step toward negative
bS: Big Sell, when an indicator changes from positive to negative
Back To Top ->
7. How to use your web function - Meter by Stock
Enter Symbol within the symbol box, and choose the date range you want and hit GO:
Table 1 Navigation Table
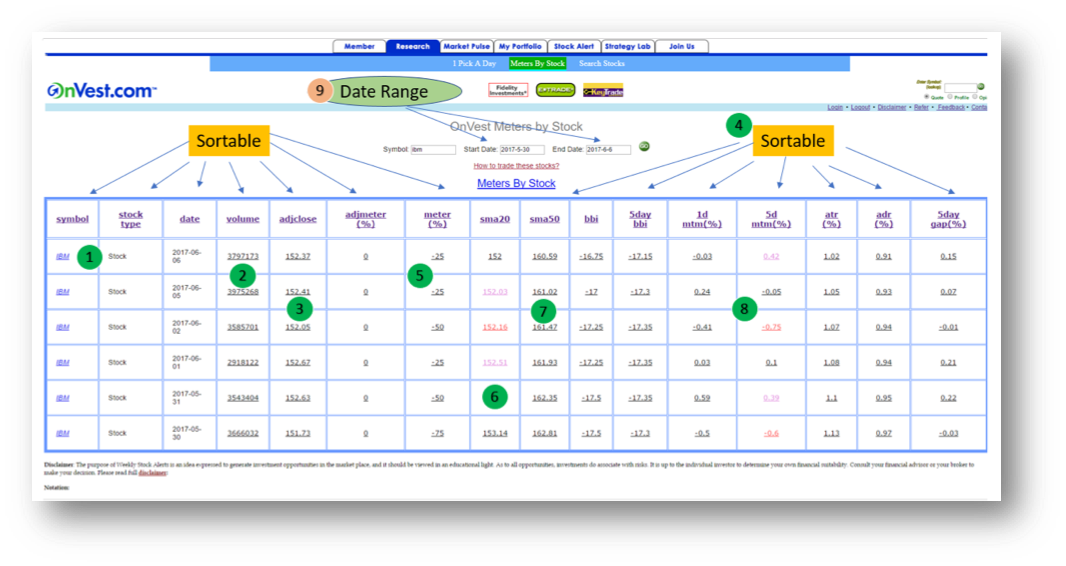
Please refer to the numbering system on the above navigation table 1:
1. When click the symbol, you will be directed to finviz.com for fundamental data, for example: http://finviz.com/quote.ashx?t=spy&ty=c&ta=1&p=d
2. When click on volume number, our chart will launch
3. When click on any number, like adjclose, adjmeter(%), meter (%), BBI, etc, their prospective chart will launch
4. Each heading is sortable: Symbol, Stock Type, Date, Volume, Adjclose, Meter, BBI, etc.
5. If you click on meter, a chart for meter will launch
6. SMA 20: When a blue (purple) number is flashing, that means that adjclose price is crossed above SMA20 today; When a red (Pink) number is flashing, it means that adjclose price is crossed below SMA20 today; If you click on the number, a chart for SMA20 will launch
7. SMA50: When a blue (purple) number is flashing, that means that adjclose price is crossed above SMA50 today; When a red (Pink) number is flashing, it means that adjclose price is crossed below SMA50 today; If you click on the number, a chart for SMA50 will launch
8. 5d mtm (%): When a blue (purple) number is flashing, that means that 5d mtm is turned positive today (it was negative yesterday); When a red (Pink) number is flashing, it means that 5d mtm (%) turned negative today, it was positive yesterday. If you click on the number, a chart for 5d mtm (%) will launch
9. The date range is customizable by clicking on start date or the end date
Back To Top ->
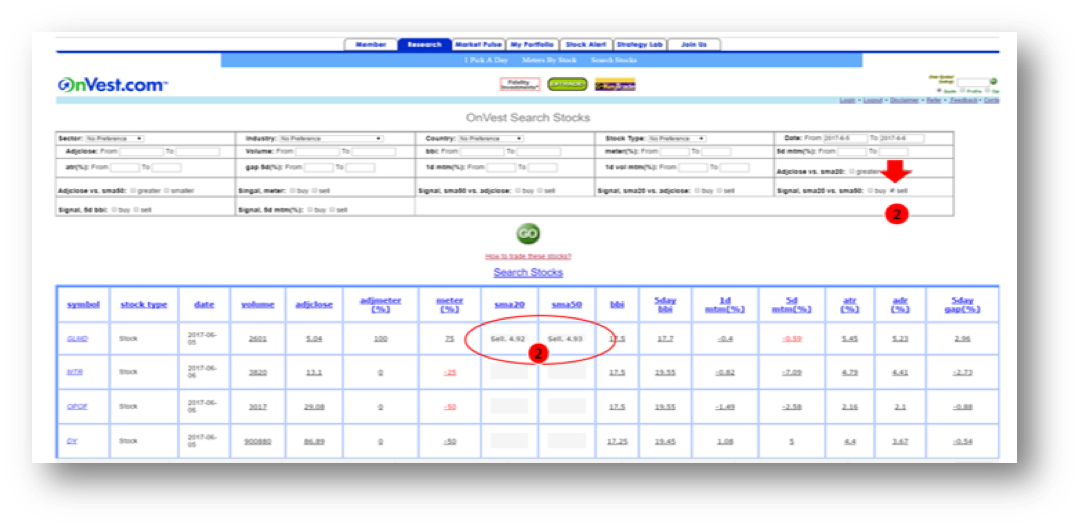
8. How to read these buy and sell on tables?
1. When SMA20 and SMA50 have buy and buy running from right to left, scrolling, that means SMA20 crosses above SMA50 today, it is a cross over buy signal
2. When SMA20 and SMA50 have “sell” and “sell” running from up to down, scrolling, that means SMA20 crosses below SMA50 today, it is a cross over sell signal
Back To Top ->
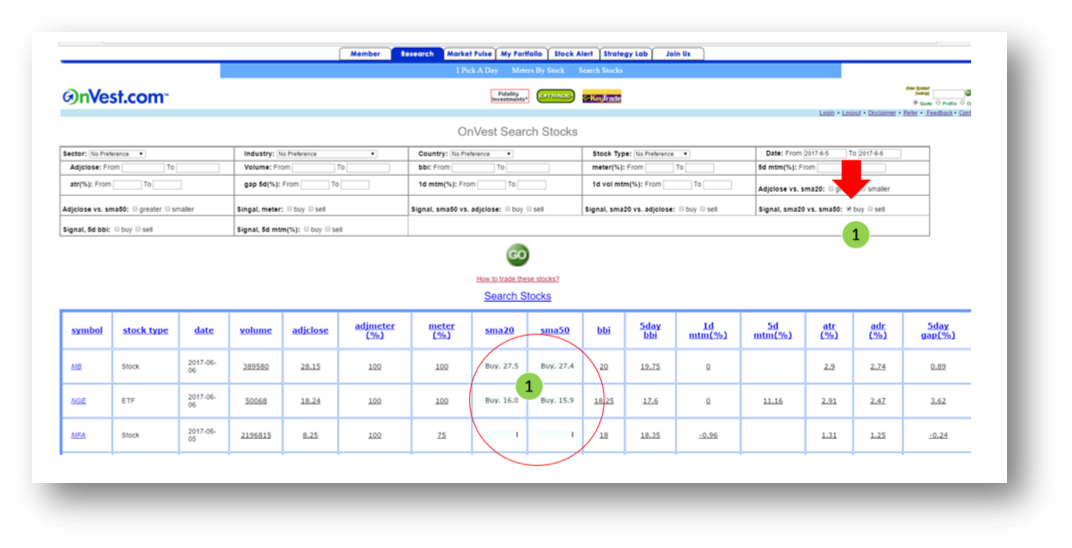
9. How do I use Search Stocks?
Search Stock is our search engine or filter, it can search according to single parameter, criteria, or multiple criteria.
Table 2 Stock Search Engine Navigation
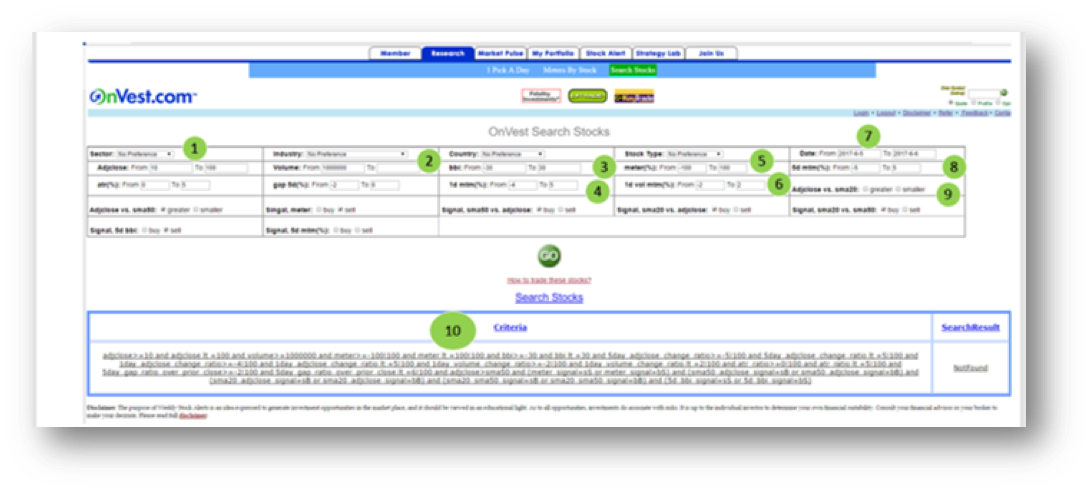
Please refer to the numbering system on the above navigation table 2:
1. Adjclose range, input the price range of the securities you want, example $10 to $100
2. Volume range, input the min volume and range of the securities you want, example: 1,000,000 (shares)
3. BBI range: it can be from -30 to +30. Negative is weak, positive is strength
4. 1d mtm (%): any negative to any positive numbers
5. Meter (%): it can be from -100 to +100. Negative is weak, positive is strength, each increment is 25
6. 1d vol mtm (%): any negative to any positive numbers
7. Date Range: it can be historical date range
8. 5d mtm (%): any negative to any positive numbers
9. Adjclose vs. SMA20: either greater or smaller. Greater means adjclose is above SMA20, smaller means adjclose is below SMA20
10. This is the link capture your criteria when there is no search result. The more strict the criteria is, the less number of result; the more relax of the criteria, you will get more search result.
11. Other criteria
Sector, Industry, Country, Stock Type, Signal
a. Sector and Industry is inter-relative, industry is subsect of Sector
b. Signals: either buy or sell, not both: You should not select both Buy and Sell for the same signal
*Please note some of the criteria are exclusive or opposite to each other, have these contradict will produce no result. You just need to explore and try different combinations.
Back To Top ->
10. How do I use the Portfolio Feature?
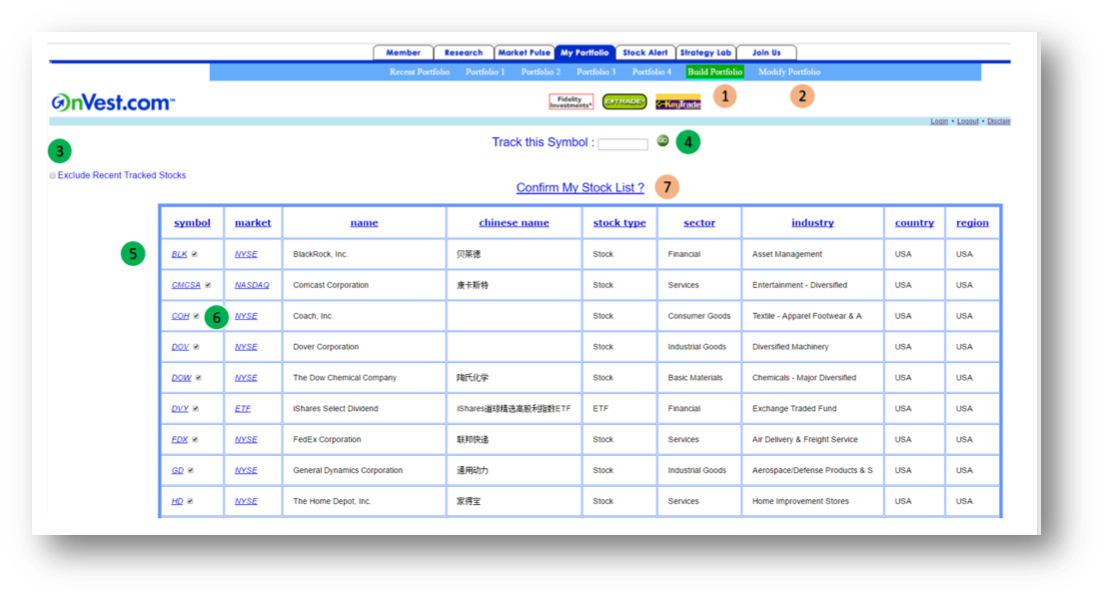
Please refer to the numbering system on the above navigation table 3:
1. Build Portfolio – click here to build a new portfolio, all changes will save to: Recent Portfolio
2. Modify Portfolio – click here to modify an existing portfolio, you will be asked for which one
3. By checking Exclude Recent Tracked Stocks, you are deleting the existing stocks
4. Enter one symbol then hit GO, a new symbol will be added to the table. You have to add symbols one at a time
5. All new symbols you enter will appear here
6. You can uncheck symbols you already added, that means you are deleting it
7. It is very important that you Confirm My Stock List? By clicking this link, you will get a confirmation of your new portfolio creation
Back To Top ->
11. How do I modify an existing portfolio?
1. Enter which portfolio to modify: 0-4, 0 = Recent Portfolio
2. Follow the same step as Build Portfolio above
3. It is very important that you Confirm My Stock List? By clicking this link, you will get a confirmation of your new portfolio modification
Back To Top ->
Copyright © 2019 OnVest.COM, LLC. All rights reserved.